Unlocking the Power of the Symmetrical Triangle Pattern in Trading
Oct 22, 2024 By Verna Wesley
Imagine watching the price of an asset steadily tighten within a narrowing range, like a coiled spring ready to snap. This coiling effect is the essence of the symmetrical triangle pattern, a fascinating phenomenon in technical analysis. It doesn't just predict a breakoutit builds suspense, leaving traders on edge, anticipating a decisive move.
The real magic? It can go either wayup or downmaking it both exciting and unpredictable. In the world of trading, where decisions hinge on precision, understanding the symmetrical triangle could be your edge in seizing that perfect moment.
What Is a Symmetrical Triangle Pattern?
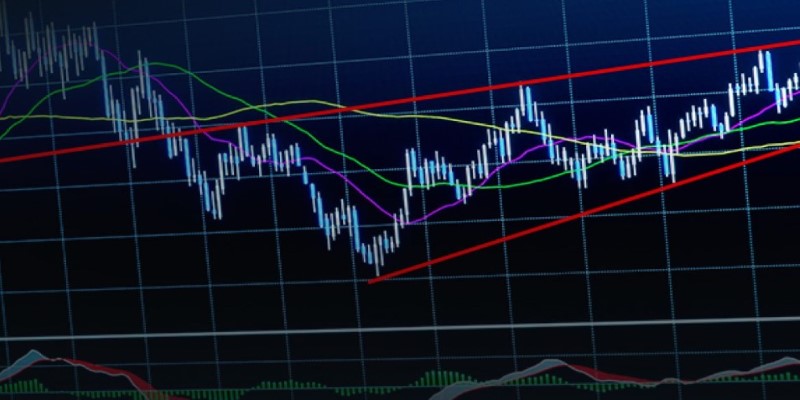
A symmetrical triangle pattern forms when price movements begin to compress within two trendlines. These trendlines, which slope towards each other, consist of a series of higher lows and lower highs. The result is a narrowing triangle shape on a price chart. This pattern suggests that the market is in a state of consolidation, with neither buyers nor sellers in full control. The symmetrical triangle is often considered a neutral pattern, as it does not inherently indicate whether the price will break upward or downward. Instead, it reflects a balance between supply and demand, with the final breakout direction revealing which side wins.
How Does It Work?
The symmetrical triangle pattern is a common chart pattern in technical analysis that signifies market consolidation before a breakout. It forms when the price moves between two converging trendlinesone connecting a series of lower highs and the other higher lows. As these trendlines converge, the price range narrows, creating a triangle shape.

During the formation of the triangle, the market typically experiences declining volume, reflecting traders' indecision about the next move. However, the symmetrical triangle pattern is neutral, meaning it does not inherently indicate whether the breakout will be bullish or bearish. The direction of the breakout (whether above the upper trendline or below the lower trendline) determines the next major price movement.
Once the price breaks out, a surge in trading volume often confirms the pattern, signaling to traders that the new trend is strong. Traders use the height of the triangle (the distance between the highest and lowest points) to estimate how far the price might move after the breakout. If the breakout is upward, the price target is the breakout price plus the height of the triangle. Conversely, in a downward breakout, the target is the breakout price minus the height of the triangle.
This pattern is popular in multiple markets, including stocks, forex, and commodities, and can be used for both short- and long-term trading strategies. Although the pattern itself doesn't indicate the breakout direction, traders often use additional indicators like the Relative Strength Index (RSI) or Moving Average Convergence Divergence (MACD) to confirm the breakout's strength and direction.
Symmetrical Triangle in Different Markets
The symmetrical triangle pattern works effectively across various financial markets, including stocks, forex, and commodities.
Symmetrical Triangle in Stocks
In the stock market, the symmetrical triangle pattern usually forms during periods of uncertainty, such as before earnings announcements or market-shifting events. It reflects a balance between buyers and sellers. Once a breakout occurs, often due to a catalyst like corporate news, the stock price typically makes a decisive move in the breakout direction.
Symmetrical Triangle in Forex
In forex trading, symmetrical triangles often emerge during periods of reduced market volatility, such as ahead of major economic reports or central bank decisions. The breakout can signal a new trend direction, with traders often using it alongside technical indicators to confirm the breakout and assess potential currency movements.
Symmetrical Triangle in Commodities
For commodities, symmetrical triangles commonly form during periods of market consolidation, such as when traders await key data on supply, production, or geopolitical events. A breakout in the pattern signals a significant price move, often driven by news impacting supply and demand, such as oil production reports or government policy shifts.
Advantages and Disadvantages of Symmetrical Triangle Patterns
Heres a look at the advantages and disadvantages of using symmetrical triangle patterns:
Advantages of Symmetrical Triangle Patterns
Clear entry and exit signals: Once the breakout occurs, the pattern provides a clear entry point, and traders can set stop-loss levels based on the triangles structure.
Applicability across markets: The symmetrical triangle pattern remains relevant in forex, stocks, commodities, or digital currency.
Trend continuation and reversal identification: This pattern helps traders identify whether the market will continue in its current trend or reverse, depending on where and how the breakout occurs.

Disadvantages of Symmetrical Triangle Patterns
While the symmetrical triangle pattern is highly useful, it also comes with certain drawbacks:
False Breakouts: As mentioned earlier, false breakouts can mislead traders into taking positions too early, only for the price to reverse back into the triangle. This can lead to premature losses.
Subjectivity in Drawing Trendlines: Different traders may draw the converging trendlines differently, leading to varied interpretations of the patterns strength or direction.
Lack of Predictive Direction: While the symmetrical triangle signals that a breakout is imminent, it does not predict the breakouts direction, leaving some uncertainty.
Conclusion
The symmetrical triangle pattern is a vital tool in technical analysis, signaling periods of consolidation and imminent breakouts. While it doesnt predict the breakouts direction, it provides clear entry and exit points, making it an attractive option for traders in various markets. However, as with any trading strategy, it's essential to use this pattern alongside other indicators and strategies to mitigate the risks of false breakouts and subjective interpretations.
By understanding the nuances of the symmetrical triangle, traders can capitalize on periods of market indecision and make informed trading decisions. Whether you're trading stocks, forex, or digital currency, mastering this pattern can give you a significant edge in navigating market trends and breakouts.

A Complete Guide About What Are Core Assets?

The Top Cities for Renters in 2024: Where to Live and Where to Avoid

Back Tax Relief: How To Get Rid Of Them

All About the Fractional Investing: Get Started in the Market Without Much Money

ETF vs. Index Fund: An Overview

Understanding Bonds and Investment Opportunities

The Gamma Squeeze: What Is It?

Andrew W. Mellon: Visionary Leader and Generous Benefactor

Doji Candlesticks: Unlocking Market Insights Through Indecision

