Doji Candlesticks: Unlocking Market Insights Through Indecision
Oct 20, 2024 By Triston Martin
Trading can feel like a complex game of tug-of-war between buyers and sellers, and sometimes, it reaches a standstill. Thats where the Doji candle comes into play. In the world of technical analysis, this candlestick pattern is a powerful indicator of market indecision. It signals that neither buyers nor sellers have gained enough control to drive the price up or down.
In this article, we'll break down what a Doji candle is, the different types you may encounter, and how traders use them to predict potential reversals or continuations in the market.
What Exactly Is a Doji Candle?
A Doji candle is a technical analysis candlestick pattern that indicates market indecision. It occurs when the opening and closing prices of a financial asset are almost identical during a specific period. This results in a candlestick that looks like a cross or a plus sign on a chart, with a very thin or nonexistent body. The name "Doji" comes from the Japanese word meaning "the same thing," reflecting the near equality of the open and closed prices.
The Doji is considered a neutral signal in and of itself. It doesnt necessarily indicate whether the market will move up or down next. Instead, it shows that buyers and sellers are equally matched during the trading session, creating a temporary pause in the market.
Types of Doji Candles
Not all Doji candles are created equal. The pattern can take different forms based on the position and length of the shadows (the wicks), which represent price highs and lows during the session. Here are the most common types of Doji candles:
Common Doji (Neutral Doji)
This is the most basic type, appearing as a cross with equally short wicks. It reflects a balance between buyers and sellers, suggesting market indecision and often appearing in consolidation phases.
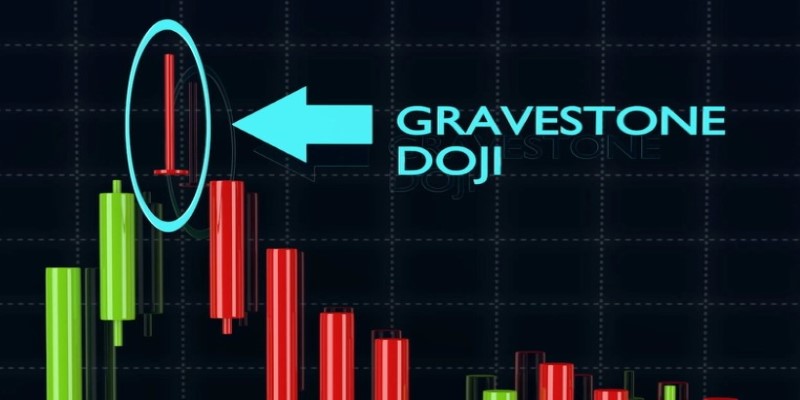
Gravestone Doji

This type of Doji has a long upper shadow and no lower shadow. It forms when prices rise significantly during the session but fall back to the opening level by the close. The gravestone Doji often appears at the top of an uptrend and can signal a bearish reversal.
Dragonfly Doji
The dragonfly Doji, the opposite of the gravestone, has a long lower shadow and no upper shadow. This pattern forms when prices fall during the session but are driven back up to the opening level by the close. It frequently signals a bullish reversal after a downtrend.
Long-Legged Doji
This pattern shows longer wicks on both sides, representing significant price swings during the session. The market moved sharply up and down but ultimately closed near the opening level, indicating higher indecision. This Doji is often a precursor to increased volatility in the market.
Doji Candle as a Trading Tool
Traders use the Doji pattern to gauge market sentiment, but its rarely used in isolation. Its most effective when combined with other technical analysis tools. Here are a few strategies that add the Doji candle:
Trend Reversal Signal: When a Doji appears at the end of a long uptrend or downtrend, it could signal that a reversal is coming. Traders often wait for the next candle to confirm the direction of the reversal before making their move.
Support and Resistance Levels: A Doji near support or resistance levels could indicate a breakout or reversal. In this case, traders will look for additional signs, such as a significant price movement in the next session, to confirm the trend.
Using Volume as Confirmation: A high volume during the formation of a Doji can add weight to the possibility of a trend reversal. Traders may look at volume indicators alongside the Doji to decide whether to enter or exit trades.
Benefits and Drawbacks of the Doji Candle
The Doji candle offers several benefits and drawbacks that traders need to be aware of when using it in technical analysis.
Benefits of the Doji Candle
Clear Indication of Market Indecision: A Doji candle signifies a balance between buyers and sellers, making it an excellent indicator of market indecision. This can be valuable for traders who are looking for key moments when the market is poised for a potential shift in direction.
Potential Reversal Signal: One of the most important uses of the Doji candle is to signal potential trend reversals. When a Doji appears after a strong uptrend or downtrend, it may indicate that the prevailing trend is losing momentum, which traders can use as a cue to prepare for a market reversal.
Useful in Combination with Other Indicators: Although the Doji candle may not offer a clear signal on its own, it can be a powerful tool when used alongside other technical analysis tools.

Drawbacks of the Doji Candle
Ambiguity in Predicting Direction: While the Doji candle highlights indecision, it does not indicate the direction in which the market is likely to move next. This lack of clarity can make it difficult for traders to use the Doji on its own as a decisive trading signal.
Requires Confirmation from Other Indicators: The Doji candle cannot be relied upon in isolation. Traders need to use it in conjunction with other technical indicators to confirm market moves.
Potential for False Reversals: A Doji does not always indicate a trend reversal. Sometimes it can appear during a strong trend, and the market may continue moving in the same direction after a brief pause.
Conclusion
The doji candle is one of the most intriguing patterns in candlestick charting. It represents a moment of indecision in the market. Whether it's a signal of an impending reversal or just a pause in the current trend, understanding how to read and interpret a doji can be an invaluable skill for traders.
However, as with all technical tools, its important to remember that the Doji is just one piece of the puzzle. Combining it with other technical indicators, market analysis, and sound judgment will improve your chances of success in trading.

How Citi is Shaping the Payments-as-a-Service of Tomorrow?

Saving For Retirement: When Is It Too Late To Have Nothing Saved For Retirement

All About the Fractional Investing: Get Started in the Market Without Much Money

Treasury Calls for More Oversight on Bank-Fintech Collaborations

How To Get Started Investing With Little Money

A Complete Guide About What Are Core Assets?

5 Essential Social Marketing Tips for Fintech Startups in 2024

Unlocking the Power of the Symmetrical Triangle Pattern in Trading

A Beginners Guide to Ordinary Shares - Its Benefits and More

