Bear Flag Pattern: A Step-by-Step Guide for Navigating Bearish Markets
Oct 23, 2024 By Vicky Louisa
The bear flag pattern is one of the most recognizable chart patterns in technical analysis. It signals the continuation of a downward trend after a brief consolidation, offering traders an opportunity to capitalize on further price declines. In volatile markets, such as those seen in 2023 and early 2024, this pattern has proven to be a reliable indicator of bearish sentiment.
Understanding how to identify and trade this pattern can make a significant difference in your trading strategy, especially when navigating unpredictable market conditions. Lets dive into the details of the bear flag pattern, how it forms, and how you can effectively trade it.
What is a Bear Flag Pattern?
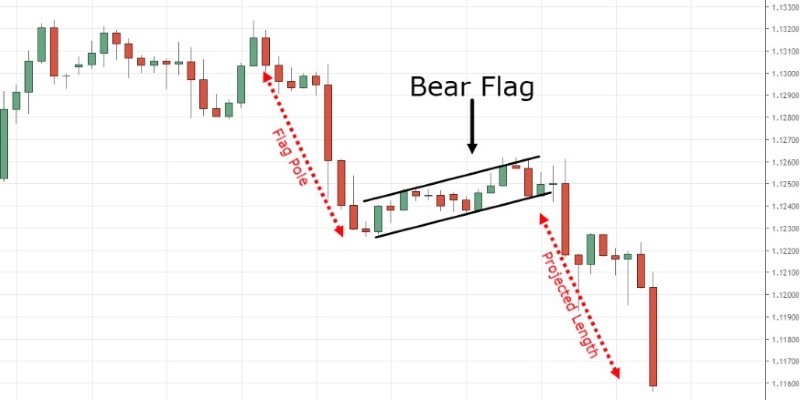
A bear flag pattern is a technical chart formation that signals the continuation of a downtrend after a brief period of consolidation. It consists of two main parts: the "flagpole" and the "flag." The flagpole represents the sharp price drop that leads into the pattern, while the flag is a temporary upward or sideways movement in price that occurs as the market takes a brief pause. This flag-like structure gives the pattern its name.
Once the price breaks out of the flag's lower boundary, it signals the resumption of the bearish trend. This breakout, usually accompanied by increased trading volume, offers traders an opportunity to enter short positions and profit from the continuation of the downward price movement.
The bear flag pattern is a valuable tool for traders because it offers a clear signal of trend continuation, allowing them to capitalize on the prevailing bearish sentiment in the market. It is particularly useful during periods of strong selling pressure or in down-trending markets, where further declines are expected.
Trading the Bear Flag Pattern
Once you've identified the bear flag pattern, you can use it to inform your trading decisions. Heres how to approach trading a bear flag:
Entry Point:
The ideal entry point for a short position is when the price breaks below the flag's lower trendline. This is the point at which the pattern confirms the continuation of the downtrend. Traders typically place sell orders just below the lower trendline to capitalize on the price decline.
Stop-Loss Placement:
Risk management is key when trading the bear flag pattern. To avoid unnecessary losses, place a stop-loss order above the flag's upper trendline. This protects your position if the breakout turns out to be a false signal and the price reverses.

Profit Target:
To set a profit target, measure the length of the flagpole and project that distance downward from the breakout point. This measurement gives you a realistic expectation of how far the price may fall once the pattern is completed.
Additional Indicators:
Combining the bear flag pattern with other technical indicators can enhance your trading strategy. Indicators such as the Moving Average Convergence Divergence (MACD), Relative Strength Index (RSI), or volume indicators can provide further confirmation of the breakout and help refine your entry and exit points.
Identifying a Bear Flag Pattern
Identifying a bear flag pattern is crucial for traders looking to take advantage of bearish trends. To spot a bear flag, you should look for a few distinct characteristics:
Flagpole:
The first step in identifying a bear flag is spotting a steep, rapid decline in price, which forms the flagpole. This sharp drop reflects strong selling pressure, pushing prices significantly lower in a short period.
Consolidation (Flag):
After the flagpole, the price enters a consolidation phase. During this phase, the price moves within a narrow range, either sideways or slightly upward, creating the flag portion of the pattern. The key here is that the consolidation does not retrace more than 50% of the initial price drop; otherwise, the pattern may not hold.
Breakout:
The breakout is the most critical element of the bear flag pattern. It occurs when the price breaks below the flag's lower boundary, signaling that the downtrend is set to continue. Increased volume during the breakout strengthens the pattern's validity.
Volume plays a critical role in identifying the bear flag pattern. During the flagpole phase, the volume is typically high as selling pressure mounts. In the consolidation phase, volume generally decreases, indicating a temporary pause in the market's selling momentum. A spike in volume during the breakout confirms the continuation of the downtrend.
Benefits and Risks of the Bear Flag Pattern
Like any technical pattern, the bear flag has its advantages and risks.
Benefits of the Bear Flag Pattern:
Clear Continuation Signal: The bear flag is a straightforward pattern that signals the continuation of a downtrend, making it easier for traders to align their positions with the prevailing market trend.
Defined Entry and Exit Points: The pattern provides well-defined entry and exit points, helping traders manage risk and maximize their potential profits.
Simplicity: The bear flag is relatively easy to spot, even for novice traders, as long as they are familiar with basic chart analysis.
Risks of the Bear Flag Pattern:
False Breakouts: One of the main risks when trading the bear flag pattern is the potential for false breakouts. This occurs when the price breaks below the flag but quickly reverses, leading to losses for traders who entered short positions too early.

Market Conditions: The pattern is most effective in strong down-trending markets. In choppy or sideways markets, the bear flag may not be reliable, and traders can be caught in false signals.
Subjective Interpretation: Identifying the flag and the breakout points can sometimes be subjective, leading to inconsistent results between traders.
Conclusion
The bear flag pattern is a powerful tool in a trader's arsenal, especially during downtrending markets. Its clear structure makes it easier to spot and trade, providing defined entry and exit points for short positions. However, like all trading strategies, it comes with risks, particularly the potential for false breakouts.
To mitigate these risks, traders should combine the bear flag with other technical indicators and practice sound risk management by setting stop-loss orders and limiting exposure. By mastering the bear flag pattern, you can improve your ability to navigate bearish markets and enhance your overall trading strategy.

Unlocking the Power of the Symmetrical Triangle Pattern in Trading

The Top Cities for Renters in 2024: Where to Live and Where to Avoid

All About International Tax Competitiveness Index 2022

Andrew W. Mellon: Visionary Leader and Generous Benefactor

Business Equity Loans Explained: Which Option Suits Your Needs

A Beginner's Guide to VA Life Insurance - Pros and Cons

Bear Flag Pattern: A Step-by-Step Guide for Navigating Bearish Markets

A Beginners Guide to Ordinary Shares - Its Benefits and More

Back Tax Relief: How To Get Rid Of Them

